IgProf Profiling Information
Application: dunetpc v06_57_00
- LArSoft/protoDune: proton_6p0GeV_mono (proton_6GeV)
- LArSoft/protoDune: beam_cosmics_p1GeV (cosmic_1GeV)
- LArSoft/Dune-FD: prodgenie_nue_dune10kt_1x2x6 (nue_dune10kt)
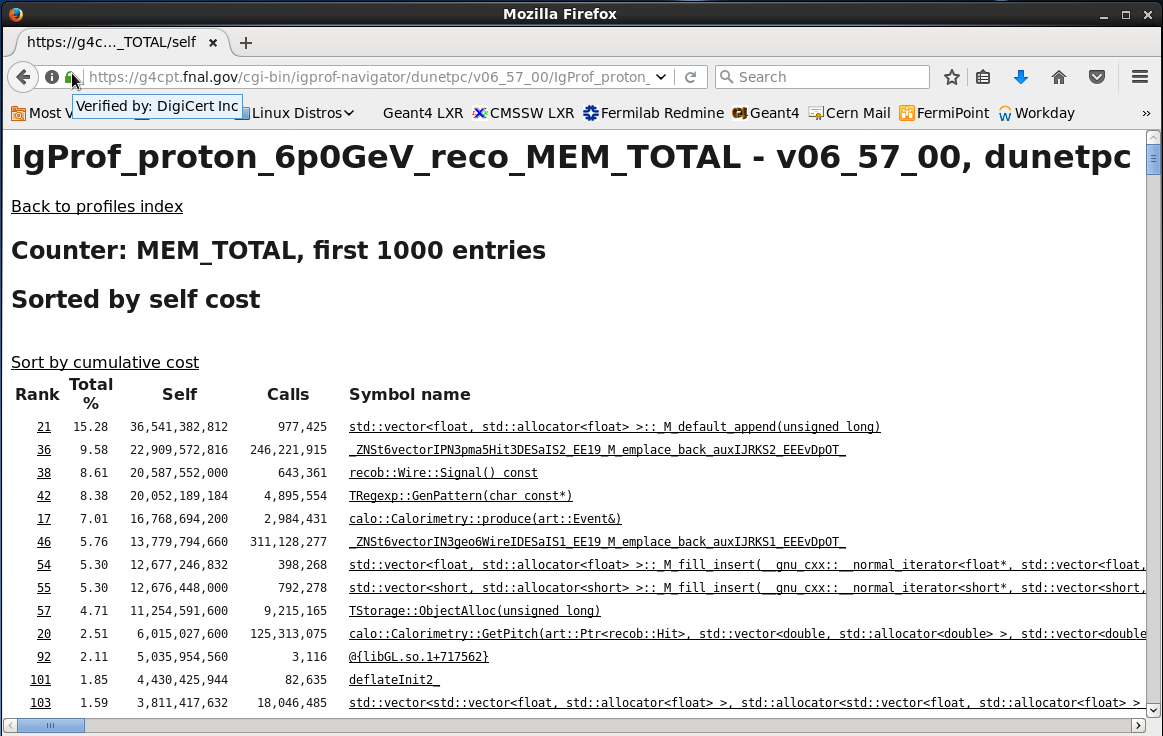
Memory Profiling Reports (web-navigable)
- MEM_TOTAL: the total amount of memory allocated by any function - a snapshot of poor memory locality
- MEM_MAX: the largest single allocation by any function
- MEM_LIVE: memory that has not been freed - snapshot of the heap, i.e. a heap profile
MEM
Processor: Intel(R) Xeon(R) CPU E5-2620 0 @ 2.00GHz, cache size : 15360 KB, MemTotal: 32845168 kB
Example analysis (for detail instructions, refer to IgProf html output description [html]
1) click a link in the talbe
2) sorted by self cost (exclusive) or sorted by cumulatative cost (inclusive)
3) navigate the report for function call paths (under Symbol name)